
null
Brand new 52-week highs is the answer.
At a time when NASDAQ-100 gets almost all of the attention, some old-school New York Stock Exchange names remain headed upward with not that much notice. You have to appreciate the diversity here as well: a consumer electronics company, a cleaning products firm and a Beantown brewing outfit.
While financials and oil stocks are having serious trouble keeping up with the Amazon
Sony, even with the new highs here, is trading at a price/earnings ratio of just 16, significantly below the current Schiller S&P 500 p/e of 29.8.
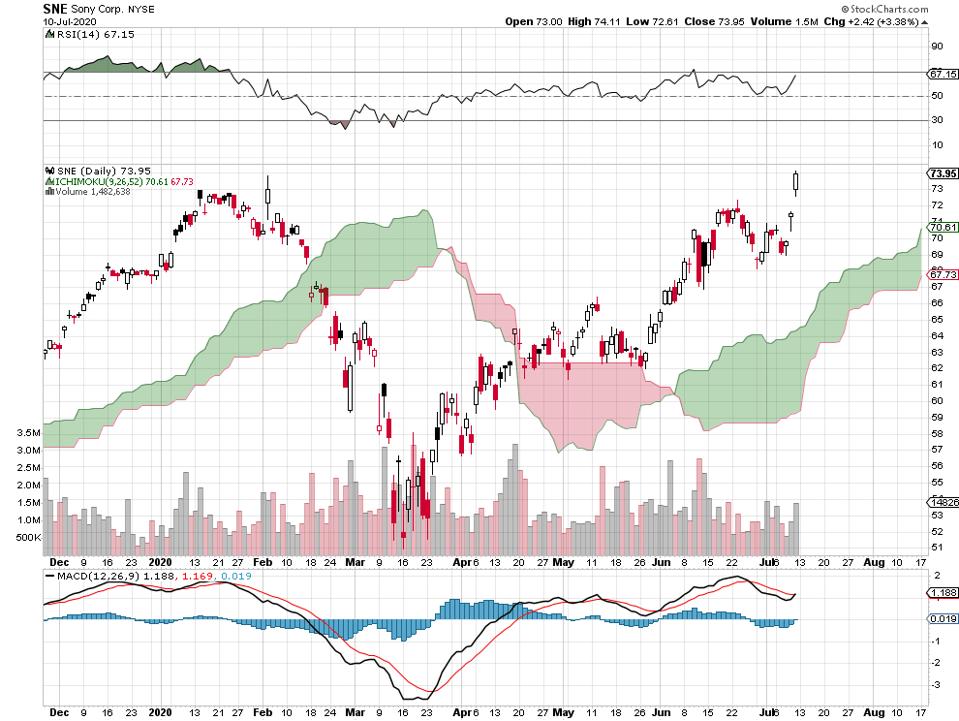
Sony daily price chart, 7 20 20.
The Japanese maker of consumer electronics goods is now higher than it was in early February before the “dump everything” hit stock markets. That Sony gapped up in price on Thursday of this week and then gapped up again even more on Friday suggests that investor sentiment may have become bullishly extreme.
Maybe I missed it but I don’t see this stock on the NASDAQ-100 components list — nonetheless, this price chart has a definite “hot tech” kind of feel to it. It’s as if Sony made it onto the “buy everything in the sector or close to it” list.
Clorox is trading with a p/e of 33, more long-term debt than equity and pays a 1.93% dividend. The short float is relatively high at 8.76%..
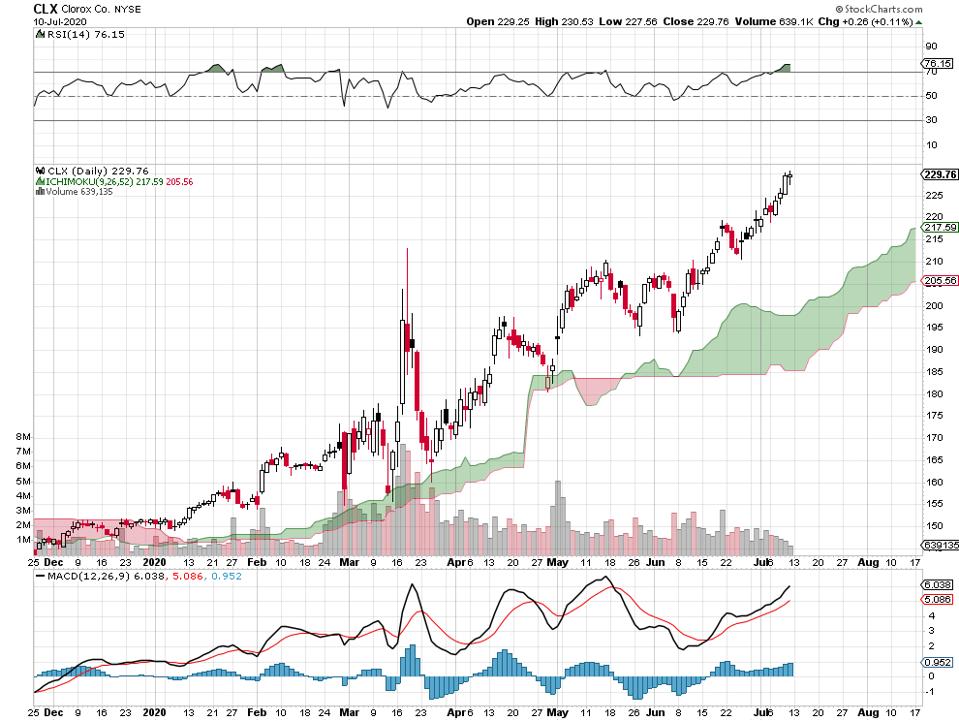
Clorox daily price chart, 7 10 20.
How nice it is to be in the cleaning products industry at a time when so many are so concerned with keeping things clean. The virtue of cleanliness is taking Clorox to these all time highs and the company makes it look so easy.
You don’t see too many price chart these days where the stock managed to stay above the Ichimoku cloud during the massive February to March selling. Lots of ups and downs along the way here, but the basic trend upward never really faltered for Clorox.
Boston Beer is trading with a p/e of 70 at this price and a short float of 14%.
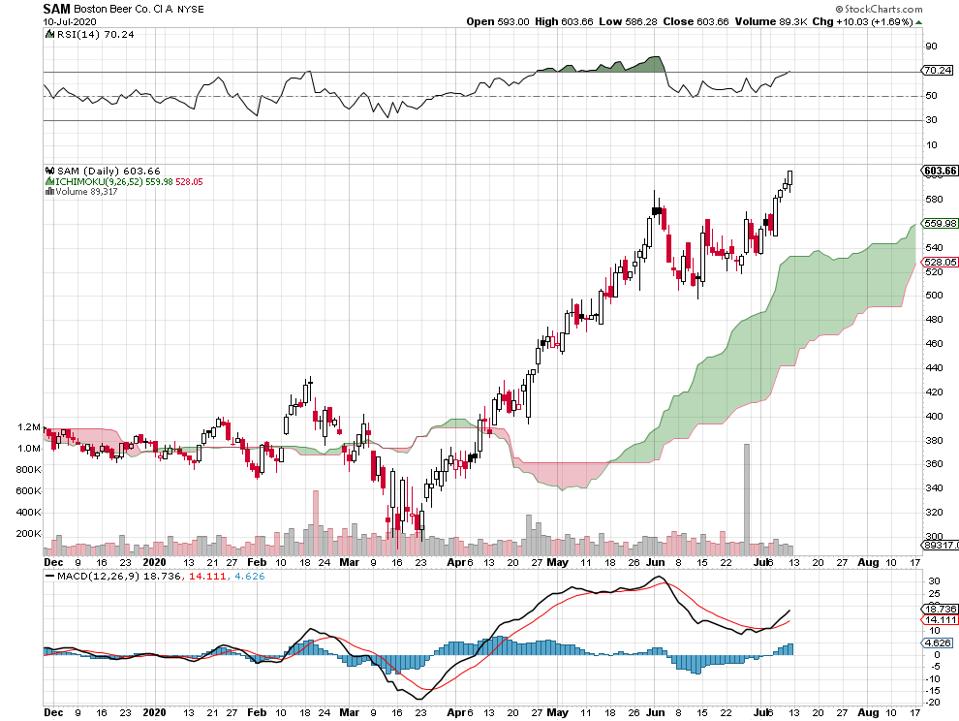
Boston Beer daily price chart, 7 20 20.
The stock recovered from the March lows by mid-April and this week took out that late May high. Note the big burst of buying volume that showed up near the end of June.
One issue that might concern price chart analysts: Boston Beer is showing big negative divergences on the relative strength index (RSI) above the price chart and on the moving average convergence/divergence indicator below the price chart. This suggests a slowing of momentum.
New 52-week highs are nice but there are no assurances that up trends now in place will continue as up trends. By one important market measure mentioned in The Stock Market’s Most Extreme Bearish Sentiment Indicator, caution about all stocks may be warranted. Past performance is no guarantee of future results.
Stats courtesy of FinViz.com.
I do not hold positions in these investments. No recommendations are made one way or the other. If you’re an investor, you’d want to look much deeper into each of these situations. You can lose money trading or investing in stocks and other instruments. Always do your own independent research, due diligence and seek professional advice from a licensed investment advisor.


No Comments
Leave a comment Cancel